Is it possible to create a chart (or perform further calculation) based on the aggregate results?
The chart and data aggregation feature cannot perform secondary aggregation on already aggregated results. For example, you cannot calculate the proportion of a value to a certain field value that was previously aggregated.
However, if you want to show the total sales amount and the achievement rate on the same screen, you can place fields for the sales amount, target amount, and achievement rate respectively on the form, and then calculate "sum" for the sales amount and the achievement rate and calculate "average" for the target amount.
In this case, we recommend using a table format rather than a bar chart. The significant difference in the number of digits between achievement rates and sales amounts makes it difficult to read the calculated rates on a bar chart.
Setting example
Form settings
Add the following fields to the form of the app:
- Date field
- Field name: Date
- Field code: Date
- User selection field
- Field name: Contact Name
- Field code: Contact_Name
- Number field
- Field name: Monthly Target Amount
- Field code: Monthly_Target_Amount
- Number field
- Field name: Sales Amount
- Field code: Sales_Amount
- Calculated field
- Field name: Achievement Rate
- Field code: Achievement_Rate
- Formula: Sales_Amount / Monthly_Target_Amount * 100
- Unit of measure: % (Suffix)
Graph settings
Configure a chart for calculation. You can specify any name for the chart.
Refer to Creating charts on the "App settings" screen.
- Chart type: Table
- Group by
- Level 1: Date, by the month
- Level 2: Contact Name
- Function
- Average: Monthly Target Amount
- Sum: Sales Amount
- Sum: Achievement Rate
- Filter: All records
- Sort by: Level 1, Ascending
Records to add
Add the following records.
| Date | Contact Name | Monthly Target Amount | Sales Amount | Achievement Rate |
|---|---|---|---|---|
| 2021-07-01 | A | 300000 | 20000 | 6.67% |
| 2021-07-08 | A | 300000 | 15000 | 5% |
| 2021-07-12 | A | 300000 | 30000 | 10% |
| 2021-07-05 | B | 250000 | 10000 | 4% |
| 2021-07-15 | B | 250000 | 50000 | 20% |
Aggregated record data
Check the aggregate result.
Refer to Creating charts
| Date (Monthly) | Contact Name | Average (Monthly Target Amount) | Sum (Sales Amount) | Sum (Achievement Rate) |
|---|---|---|---|---|
| 2021-07-01 | B | 250000 | 60000 | 24% |
| 2021-07-01 | A | 300000 | 65000 | 21.67% |
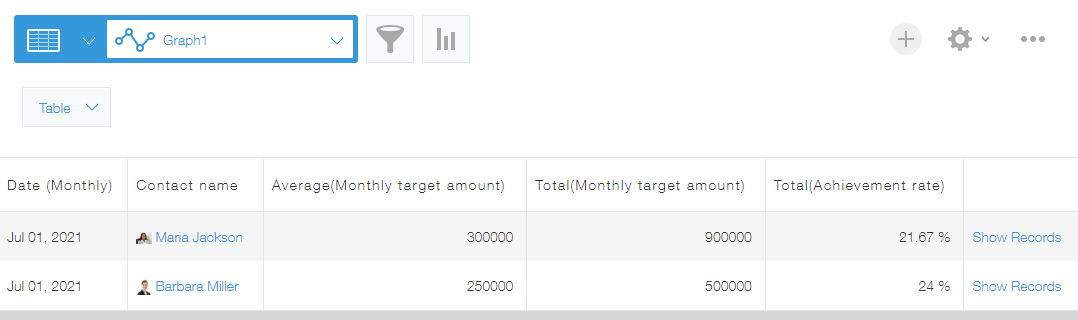
In this way, you can show the sales amount and achievement rate on the same screen.