
Checking the time spent in each status (Process analysis)
Process analysis is a feature that helps you identify issues in business processes and improve them by aggregating and visualizing the history of record statuses in apps with process management configured.
Calculates the total time that records stayed in each status based on the history and displays the results in a graph.
By understanding which statuses take the most time, you can find and improve bottlenecks in business processes.
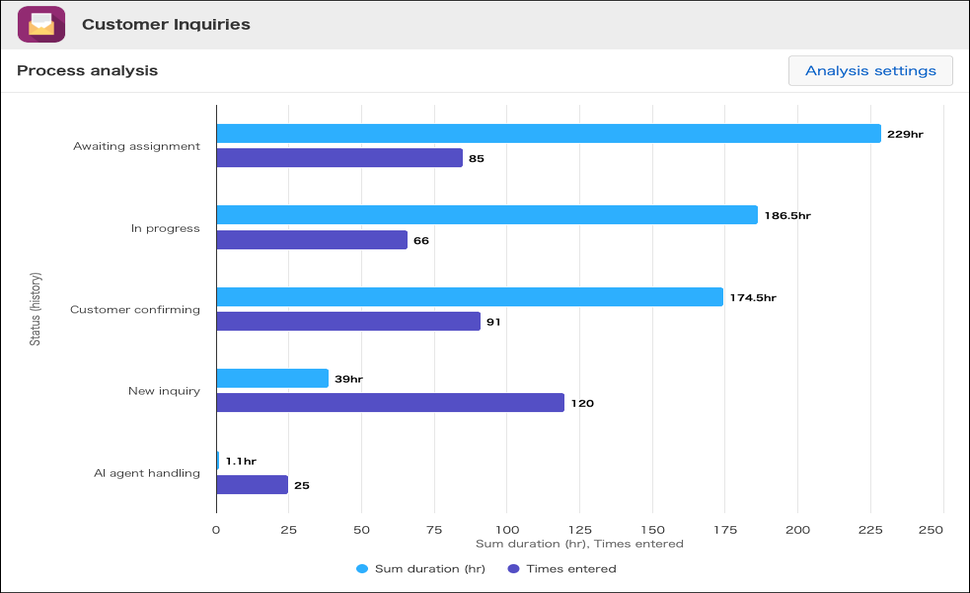
What you can do with process analysis
On the Process analysis screen, you can do the following:
- Checking the time spent in each status
When you open the screen, the total time spent in each status is displayed in a graph. - Changing the content displayed in the graph and the aggregation targets
In the Status history analysis settings dialog, you can change the following settings:- Breakdown by field value
Adding a field to Group by displays the time spent separately for each field value. For example, adding the "Product name" field lets you view the time spent for each product. - Checking the number of history entries
Adding Times entered to Metrics displays the number of history entries on the graph along with the time spent. Use this to see whether a long time spent is due to a large number of entries. - Narrowing down the records to include
Specifying conditions in Record filter conditions aggregates only the records that meet those conditions. For example, specifying the condition "Price is 100,000 yen or more" includes only the requests that meet it. - Specifying the target period
When you specify a period in Aggregation period, only the history recorded during that period is aggregated. For example, you can include only the period after you reviewed your business processes.
- Breakdown by field value
Limitations
The following limitations apply to process analysis:
- Process analysis aggregates only the records and fields that the user running the analysis has permission to view.
- When you close the Process analysis screen, the settings are discarded. To check the graph with the same settings later, configure them again.
- There is a limit to the amount of data that can be aggregated at one time. If the limit is exceeded, the results aggregated up to the limit are displayed, along with a message on the screen.
- Process analysis data is aggregated at regular intervals, so a status change may not be reflected in the aggregation results right away.
Opening the Process analysis screen
Process analysis is available in apps with process management enabled.
-
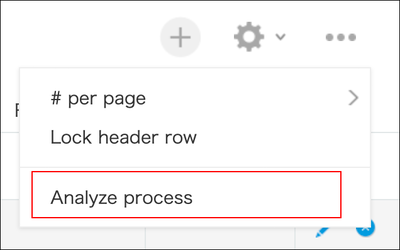
On the Record list screen of the app you want to analyze, click the Options icon (three dots) at the upper right of the screen, then click Analyze process.
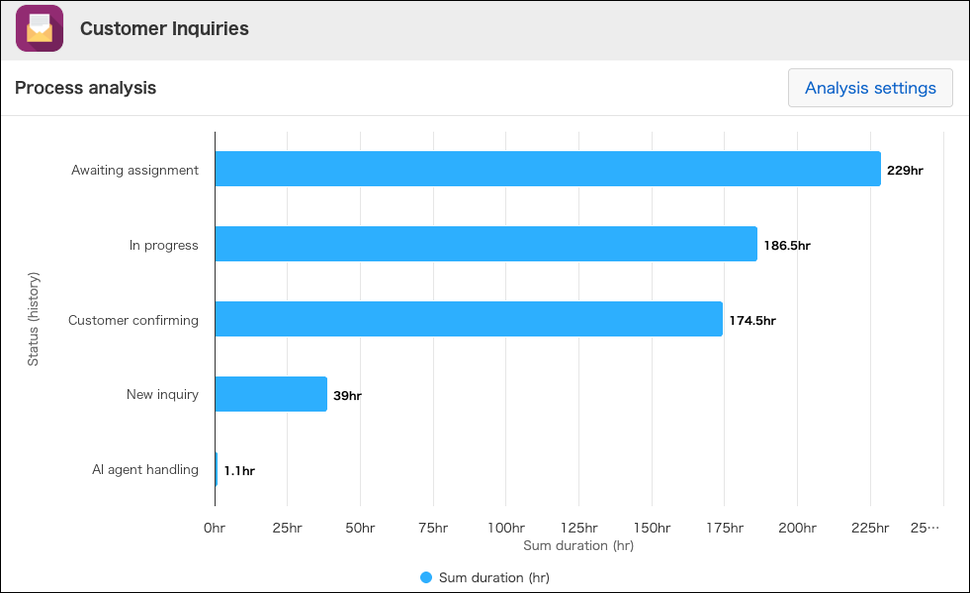
The Process analysis screen opens. Process analysis runs, and the total time spent in each status is displayed in a horizontal bar graph.
How to read the graph and how status history is aggregated
How to read the graph
In the graph immediately after you open the Process analysis screen, the vertical axis shows statuses and the horizontal axis shows the total time spent in each status.
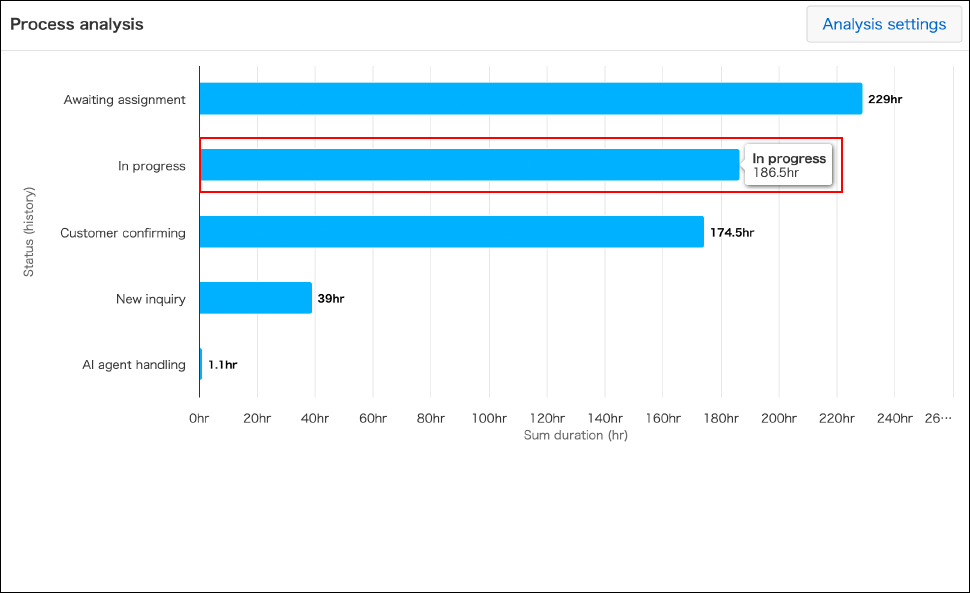
Hover over a bar in the bar graph to display detailed information about that item in a pop-up.
You can change what is displayed in the graph and what is aggregated in the Status history analysis settings dialog.
For the steps to change the settings, refer to the following section:
Changing analysis settings
How status history works
The time spent and the number of history entries displayed in the graph are aggregated based on the status history.
Status history is a record of changes to a record's status. Each time the status changes, one history entry is recorded.
The time spent is the period from when a record enters a status until it leaves that status and changes to the next one.
A record's current status is not included in the history because it has not yet changed to the next status.
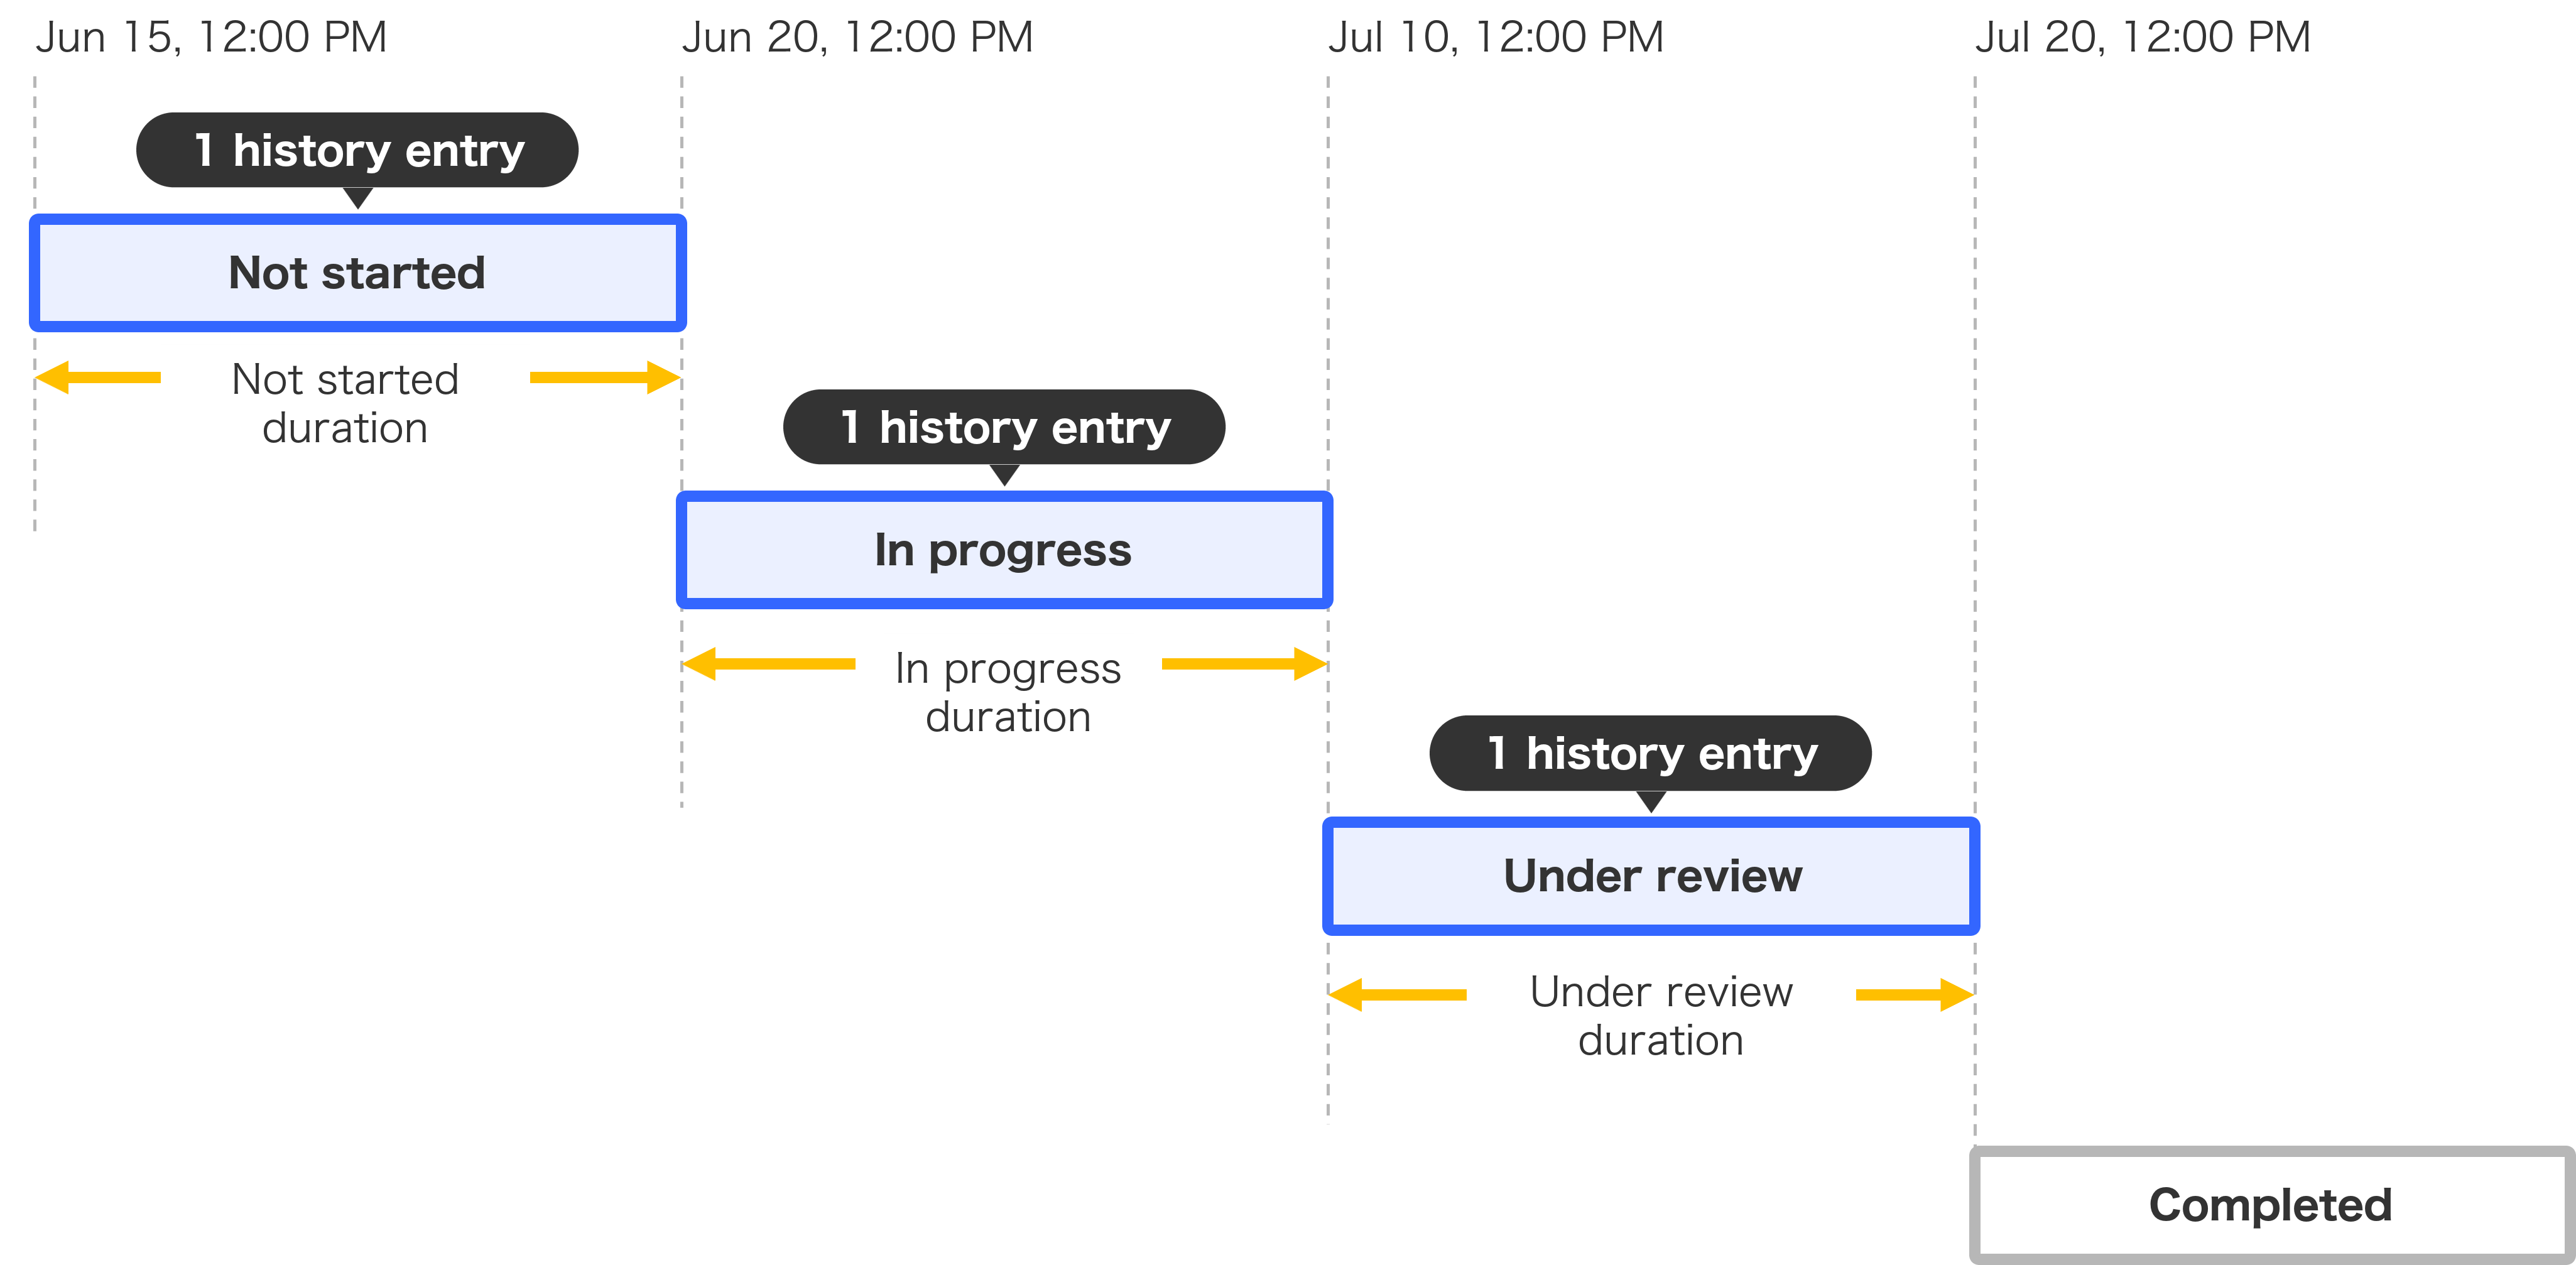
For example, suppose a record's status changes as follows. The current status of this record is "Completed".
- June 15, 12:00: Record created ("Not started")
- June 20, 12:00: Changed to "In progress"
- July 10, 12:00: Changed to "In review"
- July 20, 12:00: Changed to "Completed"
In this case, three history entries are recorded: "Not started", "In progress", and "In review". The time spent in each is aggregated.
"Completed" is the current status, so it is not included in the history, and its time spent is not aggregated.
Changing analysis settings
-
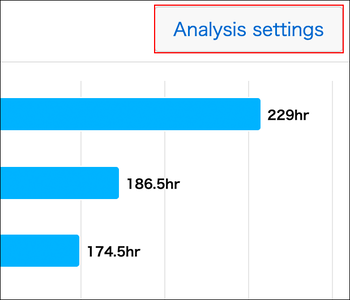
On the Process analysis screen, click Status history analysis settings at the upper right of the graph.
-
In the Status history analysis settings dialog, change the settings as needed.
For details on each setting, refer to the following sections.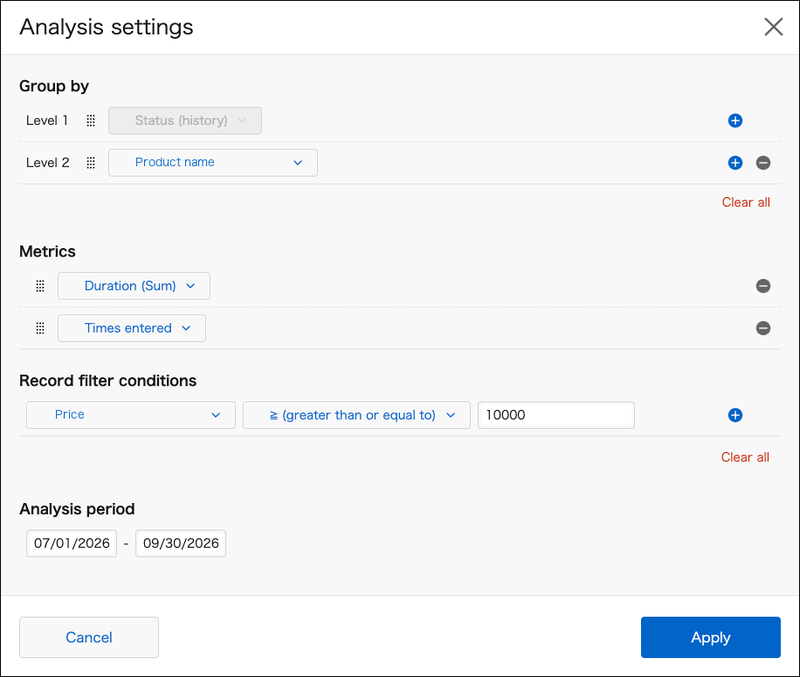
-
Click Apply.
The changed settings are reflected in the graph on the Process analysis screen.
Field settings
Group by
You can specify the fields to group the graph by and compare the aggregated results for each value.
By default, Level 1 is set to Status (all past intervals). Status (all past intervals) cannot be deleted or changed to another field.
Specifying fields
You can specify up to three fields, in the order of Level 1, Level 2, and Level 3.
To add a field to group by, click the Add a condition button (plus sign) to the right of the row, then select a field from the drop-down list in the added row.
Drag and drop the icon (dots in a row) to the left of a field to change the order of the fields.
To reduce the number of fields to group by, click the Delete this condition button (minus sign).
Clicking
Clear all deletes the settings in Group by.
Displaying the graph
The graph display changes depending on the number of fields specified.
- When only Level 1 is specified, the values of Level 1 are displayed on the vertical axis.
- When up to Level 2 is specified, the values of Level 2 are displayed as color-coded bars, and the values of Level 1 are displayed on the vertical axis.
- When up to Level 3 is specified, the values of Level 3 are displayed as color-coded bars, and the values of Level 1 and Level 2 are displayed on the vertical axis in the format "Level 1 value / Level 2 value".
Function
Metrics specifies how to aggregate the values displayed on the horizontal axis of the graph. By default, Duration (Sum) is selected.
The following metrics can be specified:
- Duration (Sum): The total time spent in the history entries for each value grouped in Group by.
- Times entered: The total number of history entries for each value of Group by.
Specifying the aggregation method
You can specify up to two functions.
To change the function, click the Function drop-down list and select one from the list.
To add a function, click the Add a condition button (+) on the right of the row, and select a function from the drop-down list in the added row.
Drag and drop the icon (a row of dots) on the left of the function to change their order.
To delete an added function, click the Delete this condition button (-) on the right of the row.
Record filter conditions
This filters the records to be aggregated.
By default, All records is selected.
If you filtered the list on the
Record list screen, that condition is preset in Record filter conditions.
To change the filter conditions, click the Record filter conditions drop-down list and select a field from the list. Then specify the condition.
To combine multiple filter conditions, click the Add a condition button (+) on the right of the row. Specify the additional condition, and select either All conditions are met or Any conditions are met.
To reduce the filter conditions, click the Delete this condition button (-).
Clicking
Clear all deletes all settings in Record filter conditions.
Aggregation period
This filters the aggregation history by period.
By default, no aggregation period is specified.
Click the input field to display a calendar. Select a date from the calendar to specify the start date and end date of the aggregation period. You can also specify only one of the two dates.
If you specify the Aggregation period, only history recorded during that period is aggregated. The total time spent includes the time before the specified period.